Tables that can be used for aligning/recording data properly but sometimes it happens that the data in the table is too long so in order to read the data properly the header respective to various columns should be available all the time while traversing the table. In such cases, a sticky table head is required to make the table more informative and accurate which can be implemented using CSS attributes.
Three ways (and one legacy way) to perform detailed customization of data being exported from DataTables to targets such as Excel, PDF, etc.
The first way gives you access to the contents of each DataTable cell being exported.
The second way gives you access to the relevant object for the export target.
The third way uses orthogonal data.
(The fourth way is included for legacy information only – but may still be useful in some situations.)
Format the Source Data Cells
This is useful for formatting the raw data of each cell in your datatable, or accessing additional HTML element and attribute data which may be in each cell’s node.
See the export data options. There are three sections which can be formatted – the data is:
format.header format.body format.footer
Example: Write contents of <input> fields in a DataTable to output Excel, to capture user-provided data:
The window object for the new window. As such the document body can be accessed using window.document.body and manipulated using jQuery and DOM methods.
See here for a full list of the different export targets.
Excel example to format the output with a thin black border on each cell:
PDF example to change the font (see full details here for how to build your own vfs_fonts.js file):
$(document).ready(function() {
  $('#example').DataTable({

    dom: 'Bfrtip',
    buttons: [{
      extend: 'pdf',
      customize: function ( doc ) {
        processDoc(doc);
      }
    }]
  });
});

function processDoc(doc) {
  //
  // https://pdfmake.github.io/docs/fonts/custom-fonts-client-side/
  //
  // Update pdfmake's global font list, using the fonts available in
  // the customized vfs_fonts.js file (do NOT remove the Roboto default):
  pdfMake.fonts = {
    Roboto: {
      normal: 'Roboto-Regular.ttf',
      bold: 'Roboto-Medium.ttf',
      italics: 'Roboto-Italic.ttf',
      bolditalics: 'Roboto-MediumItalic.ttf'
    },
    arial: {
      normal: 'arial.ttf',
      bold: 'arial.ttf',
      italics: 'arial.ttf',
      bolditalics: 'arial.ttf'
    }
  };
  // modify the PDF to use a different default font:
  doc.defaultStyle.font = "arial";
  var i = 1;
}
Use Orthogonal Data
DataTables can use the orthogonal option when expoting data:
Another export data option, similar to the above example, but this one provides the data after all of it has been gathered and pre-processed by all other formatting options:
The customizeData option is a bit of a legacy hack. It was put in place before the Excel export buttons had a customize callback and it was the only way to modify the output data.
Data is provided in arrays:
header (array) body (2-dimensional array) footer (array)
No example given, as this is probably less useful compared to the other approaches shown above.
var truncatedLength = 38; // set this to whatever you prefer

var table;
var origDataMap = new Map(); // the original (full) data for long text

$(document).ready(function() {

  table = $('#TableName').DataTable({
    columnDefs: [{
      targets: ['_all'],
      render: function(data, type, row, meta) {
        // sets up initially minimized text for content longer than truncatedLength:
        var api = new $.fn.dataTable.Api(meta.settings);
        var node = api.cell(meta.row, meta.col, {
          order: 'index'
        }).node();
        var hasToggler = $(node).children().length > 0;

        if (type === 'display' && !hasToggler && data.length > truncatedLength + 5) {
          origDataMap.set(meta.row + '-' + meta.col, data);
          var displayData = '<span>' + data.substr(0, truncatedLength) + '... </span>' +
            '<button class="moreless-button" data-state="trunc"' +
            ' onclick="showMoreOrLess(this, ' + meta.row + ', ' + meta.col + ')">more</button>';
          return displayData;
        } else {
          return data;
        }
      }
    }]
  });

});

//
// toggles the DOM table cell's contents (but it
// does not change the underlying DataTables data):
//
function showMoreOrLess(node, rowId, colId) {
  var displayData;
  var state = $(node).attr('data-state');
  var origData = origDataMap.get(rowId + '-' + colId);
  var cellNode = $(node).parent();
  if (state === 'trunc') {
    displayData = '<span>' + origData + ' </span>' +
      '<button class="moreless-button" data-state="full"' +
      ' onclick="showMoreOrLess(this, ' + rowId + ', ' + colId + ')">less</button>';
  } else {
    displayData = '<span>' + origData.substr(0, truncatedLength) + '... </span>' +
      '<button class="moreless-button" data-state="trunc"' +
      ' onclick="showMoreOrLess(this, ' + rowId + ', ' + colId + ')">more</button>';
  }
  cellNode.html(displayData);
}
The CSS:
/* makes a button look like a link */

.moreless-button {
  background: none!important;
  border: none;
  padding: 0!important;
  font-family: arial, sans-serif;
  color: #069;
  text-decoration: underline;
  cursor: pointer;
}
The HTML:
<!doctype html>
<html>

<head>
  <meta charset="UTF-8">
  <title>Demo</title>

  <script type="text/javascript" src="https://code.jquery.com/jquery-3.5.1.min.js"></script>
  <script type="text/javascript" src="https://cdn.datatables.net/1.10.23/js/jquery.dataTables.min.js"></script>
  <link rel="stylesheet" type="text/css" href="https://cdn.datatables.net/1.10.23/css/jquery.dataTables.min.css" />

  <link rel="stylesheet" type="text/css" href="https://datatables.net/media/css/site-examples.css">

  <script type="text/javascript" src="https://cdn.datatables.net/plug-ins/1.10.24/dataRender/ellipsis.js"></script>


</head>

<body>

  <div style="margin: 20px;">

    <table id="TableName" class="display dataTable cell-border" style="width:100%">
      <thead>
        <tr>
          <th>Number</th>
          <th>Severity</th>
          <th>Description</th>
        </tr>
      </thead>
      <tbody>
        <tr>
          <td>Number123</td>
          <td>S1</td>
          <td>Description size keeps on varying</td>
        </tr>
        <tr>
          <td>Number345</td>
          <td>S9 major alarm severe major alarm severe major alarm severe</td>
          <td>Unable to log on</td>
        </tr>
        <tr>
          <td>Number234</td>
          <td>S1</td>
          <td>Flashing red lights in the corner of my eyes</td>
        </tr>
        <tr>
          <td>Number765</td>
          <td>S3</td>
          <td>Description again is very very very long very very very long very very very long</td>
        </tr>
        <tr>
          <td>Number678</td>
          <td>S1</td>
          <td>Description size keeps on varying</td>
        </tr>
        <tr>
          <td>Number543</td>
          <td>S3</td>
          <td>Lorem ipsum dolor sit amet, consectetur "adipiscing" elit, sed do eiusmod tempor incididunt ut labore et dolore magna aliqua. Ut enim ad minim veniam, quis nostrud exercitation ullamco laboris nisi ut aliquip ex ea commodo consequat. Duis aute
            irure dolor in reprehenderit in voluptate velit esse cillum dolore eu fugiat nulla pariatur. Excepteur sint occaecat cupidatat non proident, sunt in culpa qui officia deserunt mollit anim id est laborum.</td>
        </tr>
      </tbody>
    </table>

  </div>


</body>

</html>
This approach allows you to process the JSON response from the ajax call, before passing the row array data to DataTables. You can therefore re-arrange the JSON data, and process additional data in the JSON if needed.
In this specific example, the option uses a function. In this case, it’s up to you to make the actual ajax call (e.g. using jQuery’s ajax API, as shown above).
The three parameters made available in this option are:
Parameter
Notes
data
The data to be sent to the server.
callback
Callback function that must be executed when the required data has been obtained from the ajax request. That data should be passed into the callback as the only parameter.
settings
The DataTable settings object.
In our example the callback function re-names the data array from row_objects to data:
This is needed because DataTables expects the data array to be called data – and the normal approach (using dataSrc: 'row_objects') is not available when the ajax function is used.
An example of the JSON handled by the above code is:
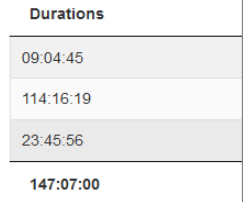
The table uses footerCallback() to populate the footer cell with a total sum of the durations (hours:minutes:seconds) shown in each row.
This then uses a reduce() function to accumulate the running total of durations. The final total is displayed in the table’s footer.
total = api
  .column(0)
  .data()
  .reduce( function(cume, current, idx, api) {
    return addDurations(cume, current);
  }, "00:00:00" );
The "00:00:00" value represents the starting value used by reduce(). It is needed here because the values in each column are assumed to be in the format of a string, as hh:mm:ss.
The full stand-alone code for the page:
<!doctype html>
<html>
<head>
  <meta charset="UTF-8">
  <title>Demo</title>
  <script src="https://code.jquery.com/jquery-3.5.1.js"></script>
  <script src="https://cdn.datatables.net/1.10.22/js/jquery.dataTables.js"></script>
  <link rel="stylesheet" type="text/css" href="https://cdn.datatables.net/1.10.22/css/jquery.dataTables.css">
  <link rel="stylesheet" type="text/css" href="https://datatables.net/media/css/site-examples.css">
</head>

<body>

<div style="margin: 20px;">

    <table id="example" class="display dataTable cell-border" style="width:100%">
        <thead>
            <tr>
                <th>Durations</th>
            </tr>
        </thead>
        <tbody>
            <tr>
                <td>09:04:45</td>
            </tr>
            <tr>
                <td>23:45:56</td>
            </tr>
            <tr>
                <td>114:16:19</td>
            </tr>
        </tbody>
        <tfoot>
            <tr>
                <th></th>
            </tr>
        </tfoot>
    </table>

</div>

<script type="text/javascript">

  // https://stackoverflow.com/users/544542/pee2pee

  $(document).ready(function() {

    var table = $('#example').DataTable( {
      "footerCallback": function ( row, data, start, end, display ) {
        var api = this.api(), data;
        // Total over all pages:
        total = api
            .column(0)
            .data()
            .reduce( function(cume, current, idx, api) {
              return addDurations(cume, current);
            }, "00:00:00" ); // initial value is this string.
        // Update footer:
        $( api.column(0).footer() ).html(total);
      }
    } );

  } );

  // a reduce() function, to add the durations in the column:
  function addDurations(cumeDuration, colDuration) {
    var cumeSeconds = durationToSeconds(cumeDuration);
    cumeSeconds += durationToSeconds(colDuration);
    return secondsToDuration(cumeSeconds);
  }

  // takes a string "hh:mm:ss", creates an int:
  function durationToSeconds(duration) {
    var hms = duration.split(":");
    return (parseInt(hms[0]) * 60 * 60) + (parseInt(hms[1]) * 60) + parseInt(hms[2]);
  }

  // takes an int, creates a string "hh:mm:ss":
  function secondsToDuration(seconds) {
    var hrs = Math.trunc(seconds / (60 * 60));
	// may need to pad mins and secs with leading zero:
    var mins = String(Math.trunc((seconds - (hrs * 60 * 60)) /60)).padStart(2, '0');
    var secs = String(seconds % 60).padStart(2, '0');
    return hrs + ":" + mins + ":" + secs;
  }

</script>

</body>
</html>