Here is the article;
https://medium.com/@dneimke/add-typescript-to-an-asp-net-core-project-e8f7411e7b58
https://www.freecodecamp.org/news/how-to-add-typescript-to-a-javascript-project/
For those that have never studied primitive vs reference types, let’s discuss the fundamental difference.
If a primitive type is assigned to a variable, we can think of that variable as containing the primitive value. Each primitive value is stored in a unique location in memory.
If we have two variables, x and y, and they both contain primitive data, then they are completely independent of each other:
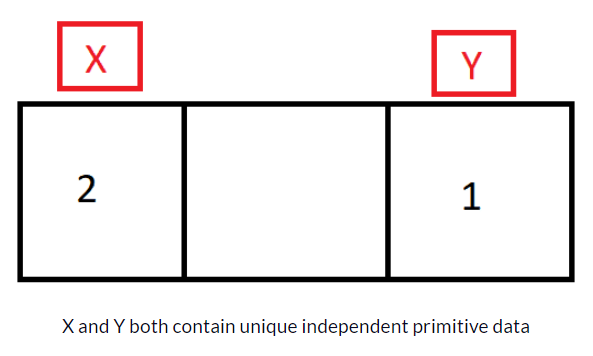
let x = 2;
let y = 1;

x = y;
y = 100;
console.log(x); // 1 (even though y changed to 100, x is still 1)
This isn’t the case with reference types. Reference types refer to a memory location where the object is stored.
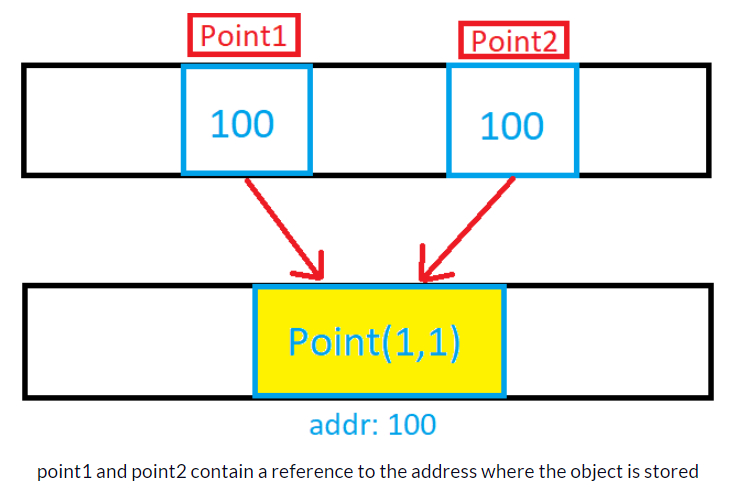
let point1 = { x: 1, y: 1 };
let point2 = point1;

point1.y = 100;
console.log(point2.y); // 100 (point1 and point2 refer to the same memory address where the point object is stored)
That was a quick overview of primary vs reference types.
To preserve device battery and reduce unwanted CPU consumptions, browsers throttle the execution of callbacks passed to the setInterval method, whenever the webpage becomes hidden. This happens whenever the browser window is minimized, the browser tab is changed and in a few other special cases.
Read more on this Medium article.
View this Demo page
Chrome (and Canary) used to be able to show javascript source which was embedded in aspx files.
Typically, I would add a debugger; statement, save, and then load my web page in Chrome with the developer tools window open. When Chrome hit the debugger; statement, it would stop and then show the javascript source, so that I could inspect variable or step through code.
A recent change has changed this so that now, when the debugger; statement is executed, Chrome dutifully stops execution but it is unable to show the source.
I had the same problem. When I clicked on the aspx page, under the Sources tab, I got a blank page. What worked for me was refreshing the page in Chrome. After that, the aspx code showed up in Developer Tools, and I was able to see , debug and search the code. This seems to be a Chrome bug.
Chrome Developer tool: html script is blank (in source) debugging tutorial
Here are the links;
How to Set Up Basic jQuery Form Validation in Two Minutes
https://www.sitepoint.com/basic-jquery-form-validation-tutorial/