Chrome Debugging tips

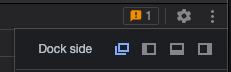
Dev tools are built into the Chrome browser. You can launch the browser and simply launch them with a short cut key (F12 on Windows or CMD_OPT_i on a Mac). Dev tools may launch either docked to a side in your browser or they can be free floating. This behavior can be toggled via the triple dot menu on the top right hand corner of dev tools, as shown in Figure 1.

Figure 1: Changing how dev tools appear

As you can see, dev tools are fairly involved. They’re organized into various tabs, such as Elements, Console, Sources, Network, Performance, and so much more.

Continue reading..

FavoriteLoadingAdd to favorites

RECENT POSTS


Categories


Tags

ADO ai angular asian asp.net asp.net core azure ACA azure administration Azure Cloud Architect Azure Key Vault Azure Storage Blazor WebAssembly BLOB bootstrap Branch and Release flow c# c#; ef core css datatables design pattern docker excel framework Git HTML JavaScript jQuery json knockout lab LINQ linux power bi powershell smart home SQL Agent SQL server SSIS SSL SVG Icon typescript visual studio Web API window os wordpress


ARCHIVE


DISCLAIMER